正文
ForensicDbg is a modern post-mortem debugger, designed from the ground-up to let you quickly and easily track down and identify your hardest to catch bugs.
We are currently running a private Beta test. If you are interested in debugging and want to ensure ForensicDbg surpasses your needs, request an invite.
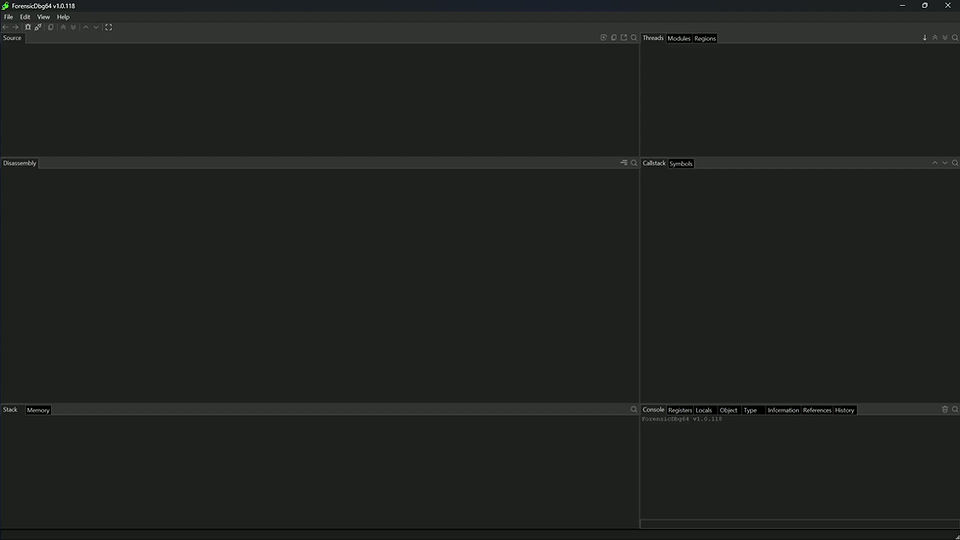

Advanced user-mode post-mortem debugger for Windows
-
Debug x86 and x64 crash dumps
-
Attach to live processes
-
Set as just-in-time debugger to debug crashes when they happen
-
Simple C++ expression evaluator
-
SourceServer and SourceLink support
-
In active development with regular updates and feature additions
MCP interface for automated crash analysis with AI tools
-
Interoperates with all AI tools that support stdio MCP Server communication
-
Output is tailored for efficient consumption by AI tools
-
Higher quality data means better results from the AI
-
Interprets and labels data so the LLM doesn’t spend time doing it
-
Reduces overall token costs while unlocking better results from your AI tools
State-of-the-art UI built to be intuitive and responsive
-
Color-coded output is understandable at a glance
-
Navigate the process space by clicking on any address
-
Memory regions are labeled with symbol names and object types
-
Objects displayed in structure initialization format
-
Multi-threaded symbol loading
-
Panels are kept in-sync as you navigate
-
Light and dark modes that match your system
Data is interpreted using decades of expert experience
-
Deduces types based on usage and references
-
Tracks register values as they flow through disassembly
-
Validates callstacks to remove misleading references
-
Simulates image loader to reconstruct missing read-only regions in mini-dumps
-
Automatically selects the thread, frame, and instruction that caused the exception
ForensicDbg gives AI tools access to its powerful debugging engine through its MCP server, greatly improving the quality of results and significantly lowering the token cost of tracking down your hardest to catch bugs.
We are currently running a private Beta test. If you are interested in debugging and want to ensure ForensicDbg surpasses your needs, request an invite.

Bug
CTextWindowBase::SetSelectionBegin doesn't null-check the CRefPtr<CTextLine> returned by GetLine() before dereferencing it to fetch m_link. This is only reachable when the window has no lines (GetLineCount() == 0) at the moment of a click — here, a disassembly panel that hasn't yet had a function/frame's code loaded into it (no region, no symbol walk, no frame selected). The fix is to guard the GetLine() result for null in SetSelectionBegin (CTextWindow.cpp around line 559) and skip the selection-link update when the window is empty.
Advanced user-mode post-mortem debugger for Windows
-
Debug x86 and x64 crash dumps
-
Attach to live processes
-
Set as just-in-time debugger to debug crashes when they happen
-
Simple C++ expression evaluator
-
SourceServer and SourceLink support
-
In active development with regular updates and feature additions
MCP interface for automated crash analysis with AI tools
-
Interoperates with all AI tools that support stdio MCP Server communication
-
Output is tailored for efficient consumption by AI tools
-
Higher quality data means better results from the AI
-
Interprets and labels data so the LLM doesn’t spend time doing it
-
Reduces overall token costs while unlocking better results from your AI tools
State-of-the-art UI built to be intuitive and responsive
-
Color-coded output is understandable at a glance
-
Navigate the process space by clicking on any address
-
Memory regions are labeled with symbol names and object types
-
Objects displayed in structure initialization format
-
Multi-threaded symbol loading
-
Panels are kept in-sync as you navigate
-
Light and dark modes that match your system
Data is interpreted using decades of expert experience
-
Deduces types based on usage and references
-
Tracks register values as they flow through disassembly
-
Validates callstacks to remove misleading references
-
Simulates image loader to reconstruct missing read-only regions in mini-dumps
-
Automatically selects the thread, frame, and instruction that caused the exception